
By Lucas Constantino Mari, founder and editor · Published October 22, 2026 · Figures checked against official sources: October 20, 2026
Advertising & affiliate disclosure: CapitalAtlass is funded by advertising. This article contains no affiliate links. How we make money · Editorial policy.
Educational content, not financial or tax advice. Rules and fees change: always confirm them with the official source.
In This Article
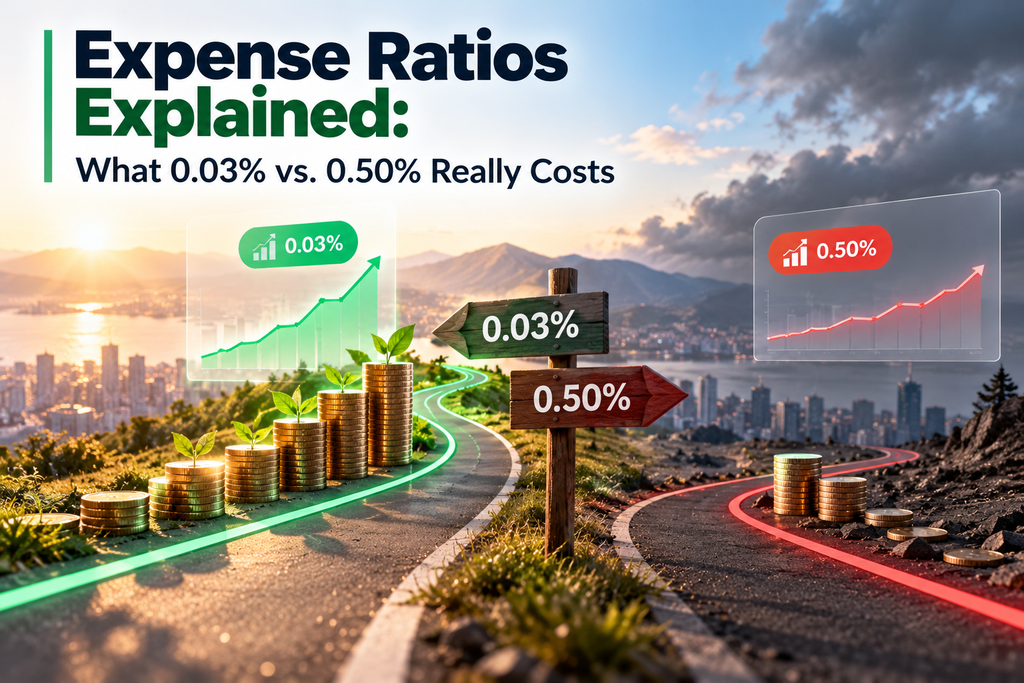
Quick answer: An expense ratio is the yearly fee a fund takes out of your investment to cover its costs. The difference between a 0.03% fund and a 0.50% fund looks tiny, but on a $100,000 investment growing for 20 years it adds up to roughly $29,000 in our example below. That is why this fee is one of the few things about a fund you can control.
What an expense ratio is
The SEC’s investor education site defines the expense ratio as “the percentage of a fund’s average net assets used each year to pay the fund’s operating expenses.” Those expenses can include the management fee, distribution (12b-1) fees and other operating costs. You never receive a bill: the fund deducts the cost a little at a time, so it shows up as a slightly lower return.
Every mutual fund and ETF must show its expense ratio in the fee table of its prospectus, and most fund providers also list it on the fund’s web page.
How much different fees cost: a worked example
To make the numbers concrete, we assumed a one-time investment of $100,000 that earns a hypothetical 6% a year before fees, compounded monthly, for 20 years. The only thing that changes is the annual fee.
| Annual fee | Value after 20 years | Lost to fees vs. a 0% fund |
|---|---|---|
| 0.03% | $329,050 | $1,970 |
| 0.10% | $324,498 | $6,523 |
| 0.50% | $299,663 | $31,358 |
| 1.00% | $271,264 | $59,756 |
The gap between 0.03% and 0.50% in this example is about $29,400, and between 0.03% and 1.00% it is close to $57,800. The money lost to fees is not just the fee itself: it is also all the growth that money would have earned over the following years.
Regular contributions: the same effect, over a longer horizon
Most people invest gradually. Starting with $10,000 and adding $300 a month for 30 years at the same hypothetical 6%:
| Annual fee | Value after 30 years | Lost to fees vs. a 0% fund |
|---|---|---|
| 0.03% | $359,320 | $2,260 |
| 0.50% | $325,957 | $35,623 |
| 1.00% | $294,355 | $67,225 |

What counts as “low cost” today
Broad index funds from the large providers are now very cheap. As of our October 2026 check, examples from official fund pages include:
- Fidelity ZERO Total Market Index Fund (FZROX): 0%
- Fidelity 500 Index Fund (FXAIX): 0.015%
- Schwab S&P 500 Index Fund (SWPPX): 0.02%
- Vanguard Total Stock Market ETF (VTI) and Vanguard S&P 500 ETF (VOO): 0.03%
- iShares Core S&P 500 ETF (IVV): 0.03%
Actively managed funds and specialized ETFs usually cost more. A higher fee is not automatically bad, but the fund has to beat its cheaper alternatives by at least the difference in fees, every year, just to break even. For a side-by-side comparison of the core funds above, see our guide to the best index funds.
Other costs to watch
- Trading commissions: most large U.S. brokers now charge $0 for online stock and ETF trades, but some mutual funds carry transaction fees.
- Sales loads: some mutual funds charge a percentage when you buy (front-end load) or sell (back-end load). These appear in the prospectus fee table, separately from the expense ratio.
- Bid-ask spread: when you buy or sell an ETF you pay a small difference between the buying and selling price. It is usually tiny for large, popular ETFs.
- Advisory fees: if you use a robo-advisor or financial advisor, their fee is charged on top of the funds’ expense ratios.
How to check a fund’s expense ratio in two minutes
- Search the fund’s ticker on the provider’s own website (Vanguard, Fidelity, Schwab, iShares, State Street, etc.).
- Look for “expense ratio”, “total expense ratio” or “net expense ratio”. If a gross and a net figure are shown, the net figure includes temporary fee waivers.
- For the full picture, open the prospectus and read the fee table at the start.
Gross vs. net expense ratio
Some funds show two figures. The gross expense ratio is the full cost of running the fund. The net expense ratio is what you actually pay after any fee waivers or reimbursements the fund company has agreed to. Waivers can expire, so if the two numbers are far apart, check the prospectus to see when the waiver ends.
Comparing similar funds: an example
Three popular S&P 500 index funds hold essentially the same 500 companies, so cost is one of the clearest differences between them. Using the figures on each provider’s page in October 2026:
| Fund | Type | Expense ratio | Annual cost on $10,000 |
|---|---|---|---|
| Fidelity 500 Index Fund (FXAIX) | Mutual fund | 0.015% | $1.50 |
| Schwab S&P 500 Index Fund (SWPPX) | Mutual fund | 0.02% | $2.00 |
| Vanguard S&P 500 ETF (VOO) | ETF | 0.03% | $3.00 |
At these levels the difference is a few dollars a year, so other factors also matter: which broker you use, whether you prefer an ETF or a mutual fund, and whether the fund is available commission-free on your platform. The lesson is different when comparing a 0.03% index fund with a 0.75% actively managed fund tracking similar stocks: there, the expense ratio gap is large enough to matter a lot over time.
Checklist before you buy a fund
- Find the net expense ratio on the provider’s fund page or in the prospectus fee table.
- Compare it with at least two funds that track the same or a similar index.
- Check for sales loads, transaction fees and minimum investments.
- If you use a robo-advisor or advisor, add their fee on top of the fund’s expense ratio.
- Recheck once a year: providers do change fees.
Frequently Asked Questions
Do I pay the expense ratio separately? No. It is deducted from the fund’s assets, which lowers the fund’s return. You will not see a separate charge on your statement.
Is the fee charged once a year? It is quoted as an annual percentage but deducted gradually, usually daily, from the fund’s assets.
Can a fund change its fee? Yes. Providers can raise or cut fees. Several large providers have cut fees in recent years, which is why it is worth rechecking occasionally.
Is the cheapest fund always the best? Not always. Two funds can track different indexes. Compare funds that track the same or very similar index, and then let cost decide.
Sources and Verification
The definition and fund expense ratios were checked on October 20, 2026. The return figures are a hypothetical calculation, not data from any real fund.
- Investor.gov (SEC): Expense ratio
- Fidelity: index funds (FZROX, FXAIX)
- Schwab: SWPPX
- Vanguard: VTI fact sheet · VOO fact sheet
- iShares: IVV
This article is for educational purposes only and does not constitute financial, investment, tax or legal advice. CapitalAtlass is not a registered investment advisor. Found an error? Email admin@capitalatlass.com.